Residential & Consumer Debt

RMBS spreads tightened during the third quarter, despite risk markets being weaker. The sector continues to be in focus given favorable dynamics for its underlying collateral, including the de-levering of mortgages and relatively strong obligors. Credit risk transfer (CRT) tranches tightened significantly, with deep credit tranches as much as 200 basis points tighter while the belly of the stack contracted by up to 100 basis points. Senior non-qualified mortgage (NQM) spreads were little changed, while BBB-rated NQM spreads tightened by 25 basis points and legacy RMBS spreads were around 10 basis points tighter. Spreads are also sharply tighter on a year-to-date basis; most spreads are 50 to 100 basis points tighter, though pockets of CRT tightened 200 to 300-plus basis points. Despite this positive performance throughout 2023, most of the sector’s spreads remain 50 to 100 basis points wide of February 2022 levels, offering a runway for additional potential upside. Year-to-date total returns were between 7% and 18% for mezz and subordinate CRT tranches and in the range of 3% to 5% for legacy RMBS.
At $15.5 billion, RMBS issuance was roughly flat quarter-over-quarter, as a decline in CRT issuance was offset by gains in jumbo 2.0 and single-family rental during the third quarter. Issuance fell 47% year-over-year in the third quarter. Year-to-date issuance totaled $49.5 billion, down approximately 62% year-over-year amid limited origination activity and higher securitization coupons. Sell-side analysts predict full-year 2023 issuance will be $60 to $70 billion, down from $127 billion in 2022 and $213 billion in 2021.
Home prices continued to rally, with the S&P CoreLogic Case-Shiller U.S. National Home Price Index up 5.3% through the first seven months of 2023, exceeding the prior peak in June 2022 by 0.6%. Of the 20 markets tracked by the S&P CoreLogic Case-Shiller Home Price Indices, 12 were at their all-time high; most of the laggards were from the west coast, including San Francisco and Seattle, where prices were below their peaks by 10.8% and 10.1%, respectively.
Prevailing mortgage rates were around 7.5% at the start of October, reaching the highest level since 2000 and making the strength in home prices even more remarkable. With the effective mortgage rate outstanding at 3.6% as of October 2023, the well-publicized “lock-in effect” has hampered existing home sales volume, which sat at a mere 4 million units. Total listings amounted to 1.1 million in August, in line with the previous few months but down significantly from pre-pandemic years. New listings, which offer a timelier view of current supply, totaled 391,000 in August – the fewest for that month since 2011, according to the National Association of REALTORS®. Cumulatively, new listings totaled only 2.95 million through August 2023, compared to 3.6 to 4.1 million in the first eight months of 2018 to 2020 and 4.0 and 4.3 million in the first eight months of 2021 and 2022, respectively.
For more information on Residential & Consumer Debt, visit angelogordon.com/strategies/credit/residential-consumer-debt/
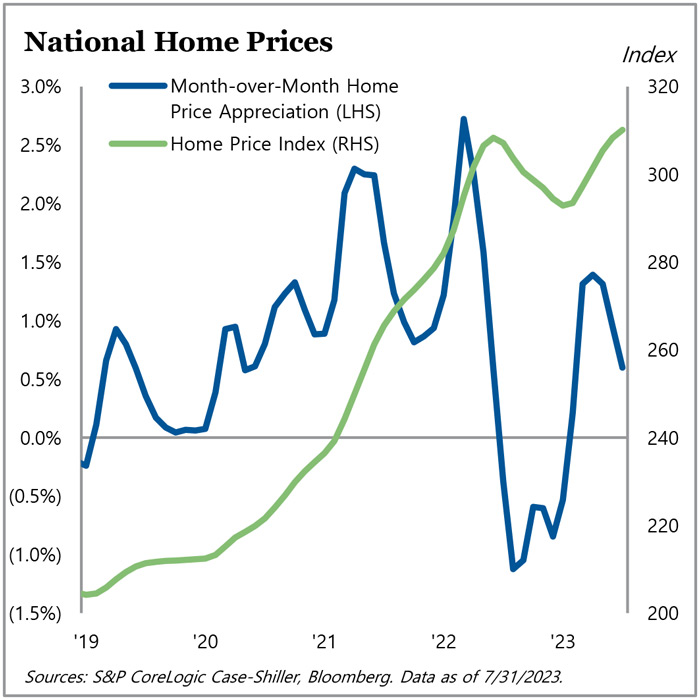
After declining in the second half of 2022, home prices have now exceeded last year’s peak.
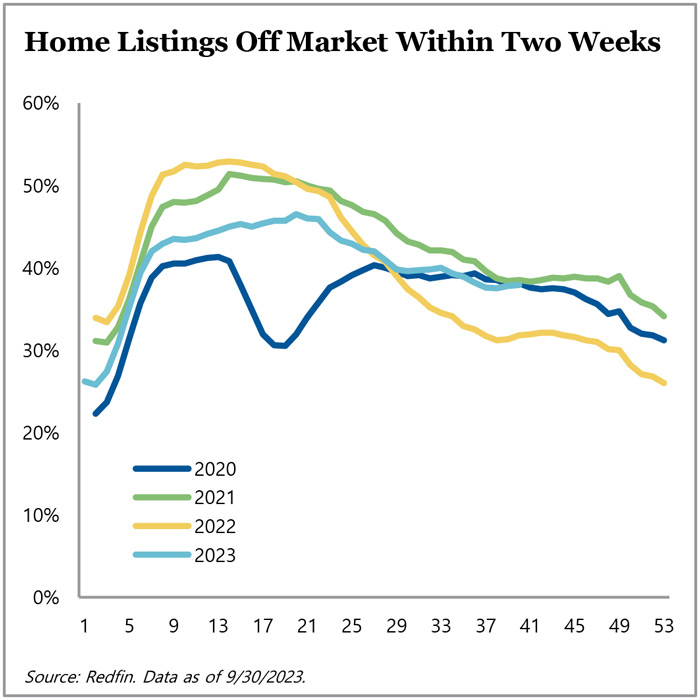
As of the end of the third quarter, the share of listings going off market within two weeks has remained consistent with the past few years.
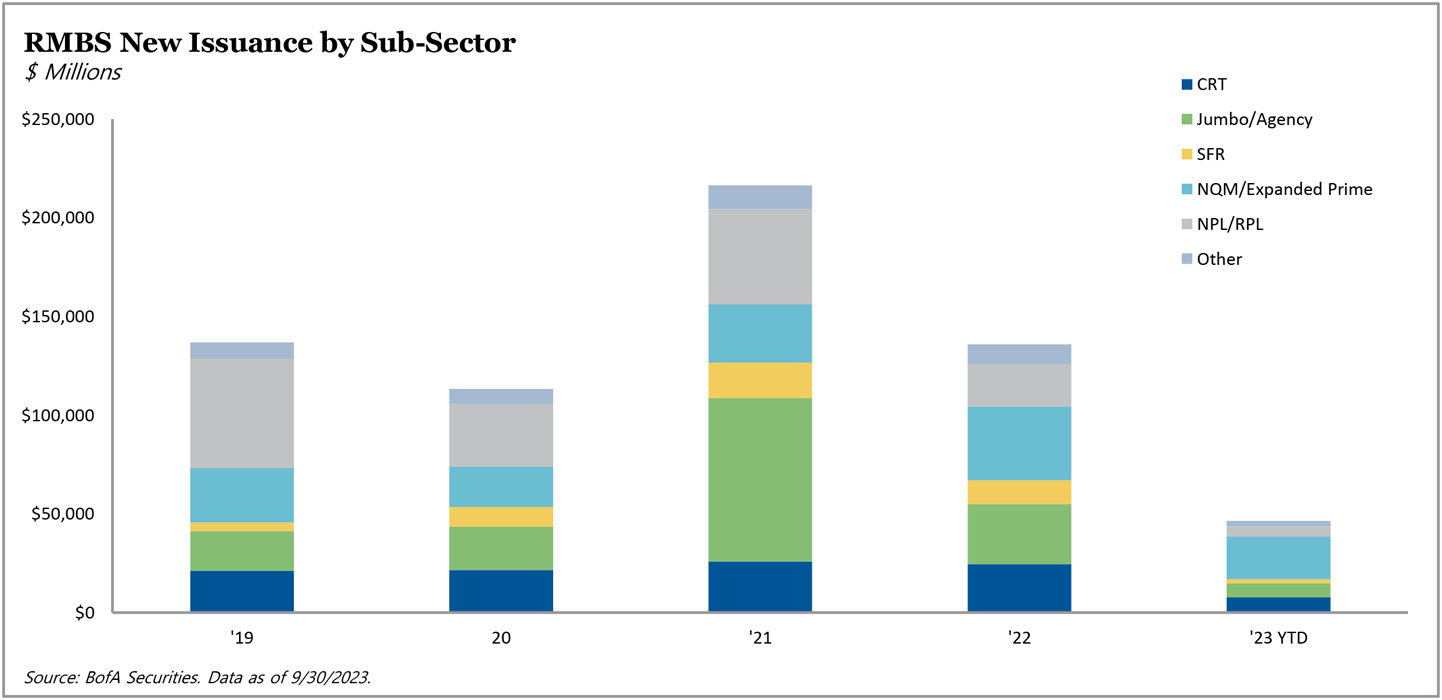
Muted housing activity has limited RMBS new issuance.
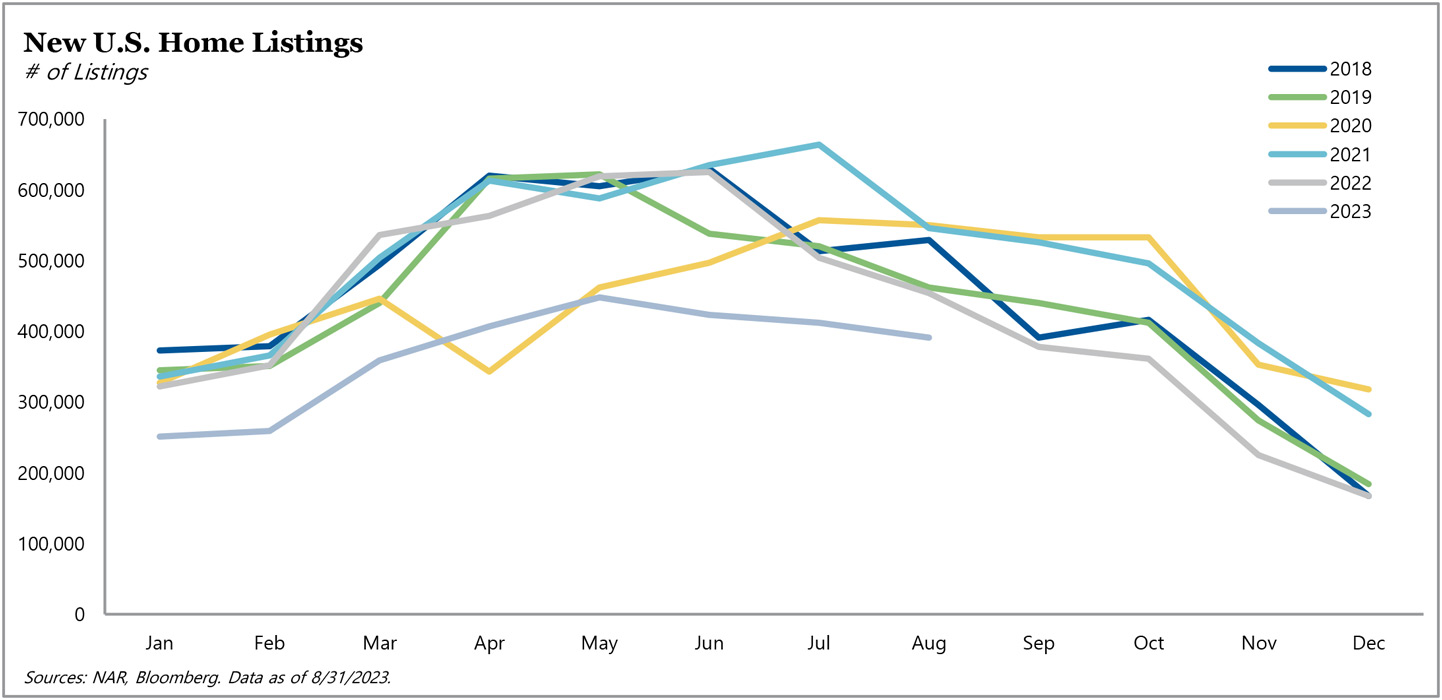
Cumulative new listings through August 2023 are well below the levels recorded in the first eight months of prior years.